

Ceddy
15+ Year Contributor
- 847
- 39
- May 10, 2006
-
Reading,
Pennsylvania
I'd like to compare some fully tuned Timing Maps, with different Engine Compressions, Fuels, Engine Displacement, etc.
And your methods and theorys in tuning them.
Be neat to see what people are using with different setups.
Because people may be using different engine management, I made this conversion chart:
Load = Used by EcuFlash.
G/Rev = Grams Per Rev, used by DSMLink.
Boost = For reference and other EMS, rough estimate, effected by turbo, VE%, etc.
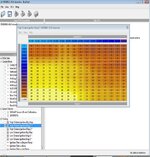
I also made a map showing when the different areas of the Timing Map are used.
The White Dots show the cells that would be hit in an example 3rd gear pull.
Some maps for comparison:
Stock 2Gb:
93 Octane
2.0 L @ 8.5:1
T25 @ 12-14 psi
Evo6 Tomei Makinen Edition Stock Map:
RazorLabs Evo8 E85:
E85
2.0 L @ 8.5:1
FP Green @ ~28 psi
* When attaching maps please use .PNG or .GIF format they have the best quality for maps.
* And include Fuel, Engine Size and Compression, Turbo and Boost.
Please attach map in every post.
Added:
Load Conversion Chart for the 1Gs.
Converts the 1-12 in the Load axis to either g/rev or "Load".
And your methods and theorys in tuning them.
Be neat to see what people are using with different setups.
Because people may be using different engine management, I made this conversion chart:
You must be logged in to view this image or video.
Load = Used by EcuFlash.
G/Rev = Grams Per Rev, used by DSMLink.
Boost = For reference and other EMS, rough estimate, effected by turbo, VE%, etc.
I also made a map showing when the different areas of the Timing Map are used.
The White Dots show the cells that would be hit in an example 3rd gear pull.
You must be logged in to view this image or video.
Some maps for comparison:
Stock 2Gb:
93 Octane
2.0 L @ 8.5:1
T25 @ 12-14 psi
You must be logged in to view this image or video.
Evo6 Tomei Makinen Edition Stock Map:
You must be logged in to view this image or video.
RazorLabs Evo8 E85:
E85
2.0 L @ 8.5:1
FP Green @ ~28 psi
You must be logged in to view this image or video.
* When attaching maps please use .PNG or .GIF format they have the best quality for maps.
* And include Fuel, Engine Size and Compression, Turbo and Boost.
Please attach map in every post.
Added:
Load Conversion Chart for the 1Gs.
Converts the 1-12 in the Load axis to either g/rev or "Load".
You must be logged in to view this image or video.
Last edited by a moderator:


") ), finally got a full tank of 94 in and have done some major logging and tweaking, this is my latest timing map with ZERO counts of knock, I used some values from snowboarders maps as a baseline and then adjusted from there.
), finally got a full tank of 94 in and have done some major logging and tweaking, this is my latest timing map with ZERO counts of knock, I used some values from snowboarders maps as a baseline and then adjusted from there.
